Design of a Simple Visible Spectrometer Based on RPi
Summary
Spectrometers are important instruments in today’s scientific research and daily experiments, and are constantly developing in the direction of portability, integration and low cost. This paper designs a simple visible light spectrometer with Raspberry Pi 4B as the core control. Optical devices such as diffraction gratings are used to construct spectroscopic accessories to realize the dispersion of compound light, and then the diffraction spectral line image is obtained by the CMOS camera, and the OpenCV computer vision library is used for image processing and analysis, and the spectral graph curve is drawn, which can be cost-effective and efficient. Realize the spectral analysis of visible light band.
Key words:
Spectrometer; Diffraction Grating; Raspberry Pi 4B; Image Processing
Foreword
Today, spectrometers are very common scientific instruments and are widely used in the fields of substance detection, analysis and identification. Many researchers use spectrometers to analyze material properties, and many universities have also set up experiments related to spectrometers. However, for most researchers, commercial spectrometers are expensive, especially for students who are difficult to use at any time in their daily learning. Therefore, to have a low-cost, simple and easy spectrometer to achieve spectral detection is a matter of great concern to many relevant researchers. In addition, the current computer vision technology is very popular, among which the OpenCV computer vision library has become the most commonly used solution for image processing and analysis, which can fully replace the human eye for image analysis and processing, and can be fully used in the processing of light spectrum and analyse. In view of this, based on the diffraction principle of light and computer vision technology, this paper proposes a simple visible light spectrometer, which can efficiently realize spectral analysis in the visible light band, and has high cost performance and portability.
1. Overall Architecture Design
The system is mainly composed of two parts: the acquisition of the spectrogram and the processing and analysis of the spectrogram. First of all, the light to be measured can be diverged from compound light to monochromatic light through a spectroscopic attachment composed of a slit, a collimating mirror, a diffraction grating, and a doublet lens. The diffused first-order diffracted light will be collected by the CMOS sensor in the camera to form a visible light spectrum. Secondly, the Raspberry Pi 4B obtains and processes the spectral image information in the visible light band, and completes the visual display of the spectral data on the external Raspberry Pi display. The overall architecture of the system is shown in Figure 1.
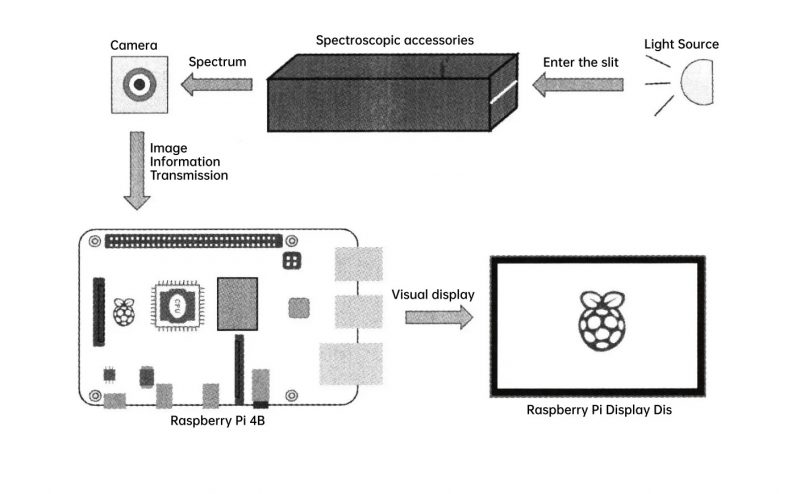
Fig. 1 Overall architecture of the device
2. Hardware Design
The hardware part consists of the core main control module and the optical splitting accessory module. Among them, Raspberry Pi 4B, CMOS camera and Raspberry Pi display work together to complete important functions such as spectral map acquisition, image processing and analysis, and spectral data visualization display. Spectroscopic accessories are mainly responsible for optical processing of detection light sources.
2.1 Main control module
In order to meet the high-efficiency, portable and low-cost requirements of the spectrometer in this design, this part selects the Raspberry Pi 4B microprocessor as the main control, which has complete functions and strong processing capabilities, and it can fully realize the functions of spectrogram processing, analysis and spectrogram curve drawing. The main control module is powered by the Type-c interface, connected to the Raspberry Pi display through the HDMI to micm-usB data cable, and connected to a high-resolution CMOS camera through the csI interface. The CMOS sensor inside the camera has high precision and strong. The photosensitive ability can accurately obtain spectral information in the visible light band.
2.2 Spectral accessory module
The self-made spectroscopic accessory module is mainly composed of slits, collimating mirrors, transmission diffraction gratings and doublet lenses. The function of the transmission slit is to reduce the stray light in the environment from mixing into the spectroscopic accessories, to ensure the purity of the human light, and at the same time, it can appropriately reduce the amount of incoming light to be measured, so as to prevent excessive light intensity from affecting the imaging of the spectrogram; the collimating mirror is mainly responsible for Collimates the light beam that the slit enters; the diffraction grating is mainly responsible for dispersing the composite light entering the spectroscopic accessory module into monochromatic light. As the core device of this accessory, the diffraction grating is directly related to the imaging effect and quality of the final visible light spectrum. . The grating diffraction equation is shown in below formula:

In the formula:
d is the grating constant;
θ is the number of diffraction angles;
β is the number of incident angles;
k is the diffraction order;
λ is the wavelength.
When the grating constant d, the incident angle number β, and the wavelength λ are fixed values, according to the above formula, it can be concluded that the larger the diffraction order κ, the larger the diffraction angle θ, and the higher the resolution of the spectrometer. The energy will gradually decrease.
The grating constant d is inversely proportional to the number N of grating lines, so the more the number N of grating lines, the smaller the grating constant d. When the incident angle β, wavelength λ, and diffraction order κ are constant values, it can be known that the more grating lines N, the larger the diffraction angle θ, and the higher the resolution of the spectrometer.
Based on the above analysis, the 1000 lines/mm diffraction grating made of glass is selected in this design, and the CMOS camera mainly collects the first-order diffracted light of the light source to be measured for analysis. The doublet lens is used as a focusing mirror in the optical path, which can converge the first-order diffracted light emitted by the grating to make the image clearer; the built-in CMOS photosensitive element of the camera can be used as a photodetector, which can accurately obtain the spectrum of the first-order diffracted light. line information and send it to the Raspberry Pi.
After designing the approximate optical path, the optical components are placed in an airtight cassette. The airtight cassette can be designed by solid works and produced by 3D printing. The entire cassette can take the form of an assembly, which allows for minor adjustments to the internal optics and camera at any time. Since the accuracy of 3D printing is difficult to meet the requirements of the smaller slit width, the slit can be constructed by “pulling the cover” to make the slit width meet the design requirements. The entire cassette must be dense and opaque except for the slit to obtain the best diffraction spectrum.
3. Software Design
The software part is mainly developed based on the OpenCV computer vision library of the Python language. Its main functions are the processing and analysis of the first-order diffracted light spectrum and the drawing of the spectrum curve. There are mainly the following two processes.
3.1 Pre-processing
The image in the computer is formed by the arrangement of many pixels on the canvas, and the color of each pixel is determined by the value of the BGR three primary color channels. At the same time, the BGR value of the pixel will determine the gray value of the pixel, and the gray value reflects the brightness of the pixel. Grayscale processing of an image to turn the image into a single-channel grayscale image is a common method of image processing in machine vision. The grayscale processing of the image is generally based on the grayscale value weighted average formula, as shown in the following formula:

In the formula:
Gray is the gray value;
B, G, R are the three-channel value of the pixel point, and the channel conversion is performed.
The cv2.cvtColor() statement can be used to realize the calculation of the BGR three-channel to gray value single-channel conversion of each pixel point, and the early grayscale processing of the spectrogram can be completed. For the grayscale spectrogram, each column of pixels in the image belongs to the same wavelength, but in actual situations, the spectral lines in the acquired spectrogram may be distorted. The gray value of each column is averaged, and this value is used as the gray value at the wavelength. Finally, the average gray value of each column of pixels and the horizontal coordinate value of the pixels can be stored in two arrays respectively, which is convenient for later calling.
3.2 Wavelength Calibration and Spectral Intensity Determination
For wavelength calibration, light sources with known wavelengths such as lasers, mercury lamps, and sodium lamps can be used as reference objects for wavelength calibration. If a light source with unknown wavelength is used, a commercial spectrometer needs to be used for detection in advance. Generally speaking, light of different wavelengths will be distributed in different pixel points in the canvas according to the large and small wavelengths, so it can be considered that there is a linear relationship between the wavelength and the abscissa of the pixel point, and it can be set to satisfy the function formula, as shown below shown in the formula.

In the formula:
λ is the wavelength value;
x is the horizontal coordinate value of the pixel point;
k is the proportional coefficient;
b is a constant.
Therefore, the wavelength calibration procedure can be designed as follows.
1) Use a self-made spectrometer to obtain the spectral line diagram of the light source with the calibrated wavelength, and obtain the abscissa of the pixel point corresponding to the imaging position of the characteristic spectral line and the wavelength value of the known characteristic peak.
2) Perform linear fitting on MATLAB, and the proportional coefficient Ni and the constant 6 can be solved, and finally the functional relationship between the wavelength and the horizontal coordinate value of the pixel point can be obtained.
3) Let =390 again, and the value of x is solved to be the abscissa of the starting pixel in the visible light band. Similarly, the abscissa of the end pixel in the visible light band can be obtained.
In this paper, the low-pressure mercury lamp is used as the reference for wavelength calibration. The characteristic wavelengths of the low-pressure mercury lamp are generally 404.7 nm, 435.8 nm, 546.1 nm, 577.0 nm and 579.1 nm. The spectral line diagram, the abscissa of the corresponding pixel points of the characteristic wavelength in the spectral line diagram is 88, 143, 353, 410 and 415 in turn. Linear fitting is performed in MATLAB, and the fitting image is shown in Figure 2.
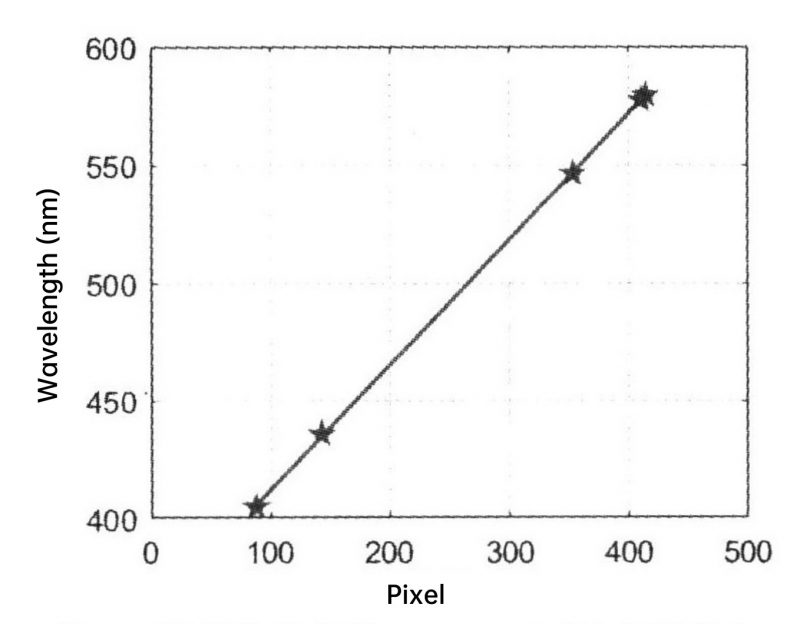
Fig. 2 Fitting of characteristic wavelength of low-pressure mercury lamp and abscissa value of pixel point
Therefore, the relationship between the wavelength and the abscissa of the pixel point can be obtained as shown in the following formula:
![]()
In the formula:
λ is the wavelength value;
x is the horizontal coordinate value of the pixel point.
According to the visible light wavelength λ range (390 nm to 780 nm), the approximate range of the abscissa x of the pixel point is 59 to 792. In this design, since the camera is fixed in the same position, the imaging position of the spectrogram will also remain unchanged, and only the image information in this range needs to be calculated later. In terms of spectral intensity, since the gray value of a pixel point determines the brightness and darkness of the point, the gray value of the corresponding pixel point of each wavelength of monochromatic light can be used as the relative spectral intensity to approximate the spectral intensity.
4. Use the effect test
In order to verify the accuracy and use effect of this simple visible light spectrometer, a certain brand of eye protection small table lamp, GY-5 low pressure sodium lamp and GY-11 He-Ne laser were tested in this paper. Aim the self-made spectrometer at the light source and adjust the angle appropriately until a clear spectrum appears in the preview window. Then the Raspberry Pi obtains this image, performs spectral processing and analysis, and finally draws a spectral curve.
First, the spectrogram of the small desk lamp is detected, and the result is shown in Figure 3. According to Figure 3, the spectrum of this light source is a continuous spectrum, and the curve has 3 characteristic peaks, which are roughly located at 450 nm, 510 nm and 580 nm. The largest, which is consistent with the spectral characteristics of most warm-color LED desk lamps on the market.
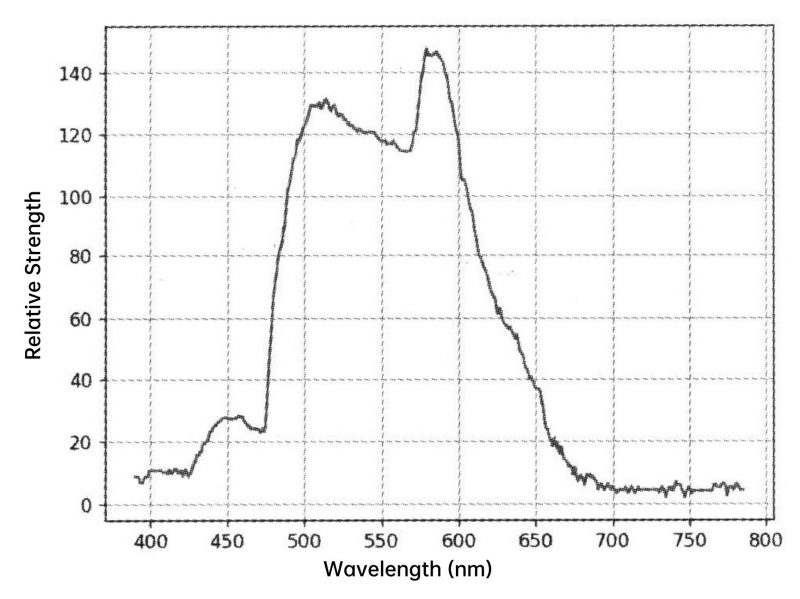
Fig. 3. Simple visible light spectrometer to measure the spectrum curve of eye protection small desk lamp
Next, the spectrum of the low-pressure sodium lamp was detected. The low-pressure sodium lamp is a monochromatic yellow light source, the wavelengths of the light emitted are 589.0 nm and 589.6 nm, the two spectral lines are very close, and the monochromaticity is extremely high. Use a self-made spectrometer to detect its spectral curve, and the results are shown in Figure 4.
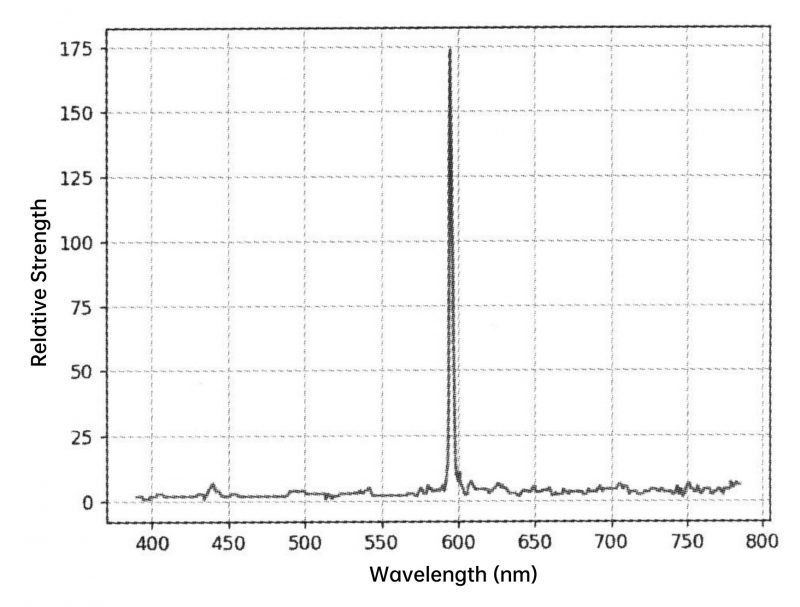
Fig. 4. Simple spectrometer to measure the spectrum curve of low pressure sodium lamp
According to Figure 4, the low-pressure sodium lamp spectrum measured by the self-made spectrometer is a linear spectrum, and its spectral curve has a characteristic peak, which is roughly located at 590 nm, which is almost the same as the double-peak position of the sodium lamp. In addition, due to the limited resolution of this spectrometer, the dual wavelengths of the low-pressure sodium lamp cannot be resolved, so only one characteristic peak is displayed in the spectral curve.
Finally, the spectrum of the He-Ne laser was detected, and the results are shown in Figure 5. According to Figure 5, it can be seen that the spectral curve has a characteristic peak, which is roughly located at 631.6 nm, which is smaller than the wavelength of 632.8 nm given by the manufacturer, indicating that the wavelength calibration of the spectrometer is more accurate.
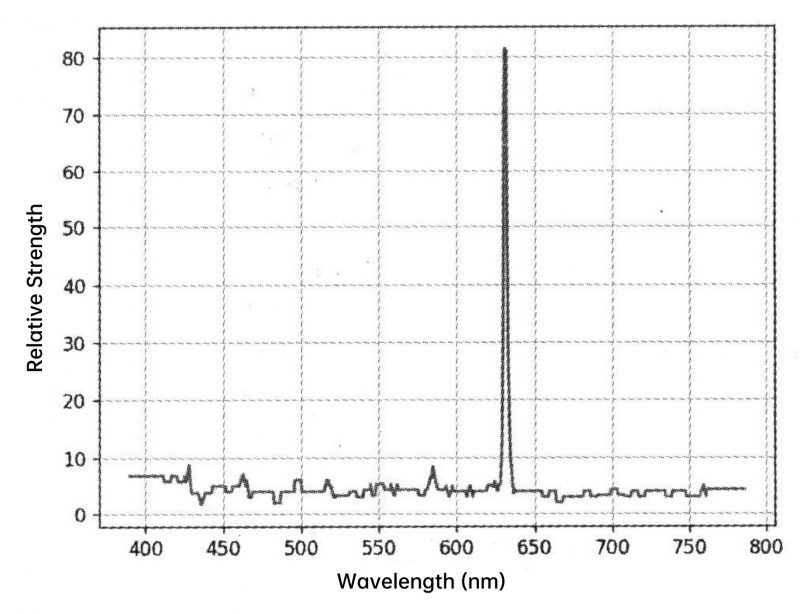
Fig.5 The spectrum of He-Ne laser measured by a simple spectrometer
5. Conclusion
The design is mainly controlled by Raspberry Pi 4B, using the principle of diffraction grating and image processing technology to process and analyze the spectrum obtained by the CMOS camera, and draw a spectrum curve. Use a self-made simple spectrometer to detect the spectral curves of the small table lamp, low-pressure sodium lamp and He-Ne laser in turn. From the analysis of the curve, it can be inferred that the spectrometer can basically and accurately represent the spectral characteristics of the light source, and the use effect is ideal. It can be applied to simple visible light spectral detection, experimental teaching and other scenarios.