Design of 90° Tiling off-Axis Parabolic Mirror Based on Focusing Terminal of High-Power Solid-State Laser
optical devices; 90° tiling off-axis parabolic mirrors; high-power solid state lasers; tilt/tip-piston parameters
Abstract
Off-axis parabolic mirror is extensive used in non-aberrant targeting by high energy short-pulse solid-state laser. With the incremental requirement for focal energy, the multi-laser focal target is often applied, which puts forward a new request for focusing element. The large-bore tiling parabolic mirror can ensure more that the profile accuracy is over λ/4 and has good augment ability. 90° off-axis design can effectively increase focal efficiency. Based on geometrical optics and diffraction optics, the focal character of 90° off-axis segmented parabolic mirrors has been studied and the misalignment of angle and position are concerned. The results show that the out-of-plane tilt/tip and piston are the main factor affecting strehl ratio and power ratio in a 20 µm-dia meter barrel, discarding the in-plane rotary and decent in active control. The accuracy of tilt/tip and pistion are respective ±0.5 µrad,土105.3 nm,and the focal performance is predicted by Monte-Carlo tolerance analysis. Under the situation, the ideal focal spot can be afforded for application.
1 Introduction
In high-energy short-pulse laser devices, the energy of a single pulse is far from meeting the experimental requirements (the fast ignition scheme requires 100kJ of laser energy to achieve high-gain nuclear fusion), and researchers began to try to stack multiple ultrashort pulses in the far field. method to obtain sufficient energy and power density.
Large-scale solid-state laser installations under construction include:
- The design goal of Japan’s LFEX (Laser for Fast Ignition Experiment) is to achieve coherent focusing of 2 × 2 beams.
- The ARC (Advanced radiography capability) of the National Igmition Facility (NIF) will coherently focus five groups of 2×2 beams.
- The European HiPER (High Power Laser Energy Research Facility) device plans 24 lasers to complete coherent focusing in time and space.
Limited by the surface processing capability and scalability requirements of large-aperture aspheric optical components, the designer proposes to use a splicing technology similar to an astronomical telescope to achieve terminal splicing and focusing.
The methods of designing and analyzing the focusing characteristics of spliced astronomical telescopes mainly include geometric ray tracing and Fourier transform. The integrated model of VLOT (Very Large Optical Telescope) is designed using geometric ray tracing, and the Fourier transform theory is used to analyze the splicing. Diffraction properties of telescopes.
The former is easy to calculate and simple to design, but the point-like distribution map on the focal plane is not enough to describe the actual performance of the splicing element. Directly using the Fourier transform can better describe the effect of the misalignment error between the splicing sub-mirrors on the focusing characteristics, but when including The computational complexity will be greatly increased when the sub-mirror angles are misaligned.
Considering that the output laser pulse width of the high-energy short-pulse solid-state laser device is in the order of picoseconds, the pulse travels through a transmission distance of 3mm in 1ps time, and the near-field wavefront error corrected by the adaptive optics system is in the order of micrometers. The non-overlapping part of the wave train is a very small amount for the entire wave train length, which meets the requirement of temporal coherence, so the above method can still be used to analyze the spatial coherence of the focusing terminal.
In this paper, when analyzing the focusing characteristics of 2×2 spliced 90° off-axis parabolic mirrors, two methods of geometric optical tracing and Fourier transform are used at the same time. The Fourier transform reflects the influence of the wavefront error on the focusing performance to the focal spot shape, and determines the influence of the in-plane and out-of-plane tilt angles and position offsets on the focal spot shape, thereby giving the control accuracy of the angle and displacement, And, the Monte Carlo error analysis method is used to predict the focusing performance of the system within the accuracy range.
2 Model establishment and solution
2.1 Ray tracing from the light source to the image plane
It is assumed that the incident light is a rectangular beam with weights (representing the spatial light intensity distribution), and a rectangular array is used to represent the incident wavefront as shown in Figure 1.
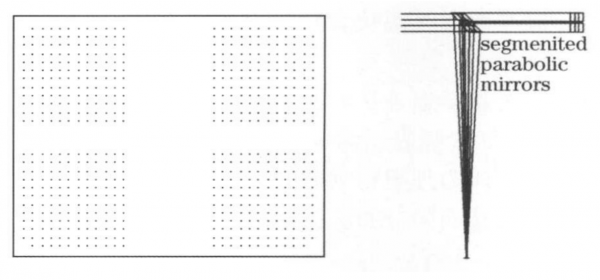
Fig. 1 Incident laser latteice and corresponding 2×2 ray tracing map
Taking any point in the figure, as shown in Figure 2.
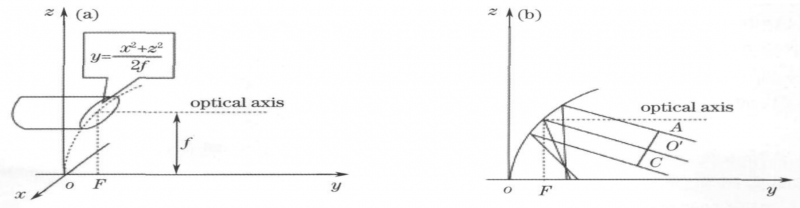
Fig. 2 Schematic diagram of 90° off-axis parabolic mirror. (a) coordinates schematic,(b) laser beam focused by a parabolic mirror at misalignment angle of θ
The corresponding incident equation and paraboloid equation can be obtained from the known declination value (F represents the lateral focal length, and f represents the longitudinal focal length):

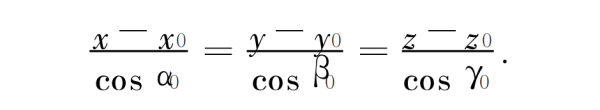
The joint solution (discarding the large false solution) can obtain the intersection of the incident light and the paraboloid ( x0, y0, z0 ). From the above formula, the normal of the paraboloid at the intersection point is

Using the angle relationship between the incident ray, the reflected line and the normal line, the direction angles of the reflected line α0, β0, γ0 can be obtained. The reflection line is
The position of the corresponding light spot in any z-plane can be obtained, taking all the points in Figure 1, and taking the light intensity at the corresponding point as the weight, the shape of the light spot and the approximate light intensity distribution in any z-plane can be obtained.
2.2 Exit pupil position optical path difference
Knowing that the traced ray is traced backward to the exit pupil position at the intersection of the image plane and the cosine value of the direction, the optical path difference between the focal spot and the exit pupil position can be obtained. The specific process is shown in Figure 3.
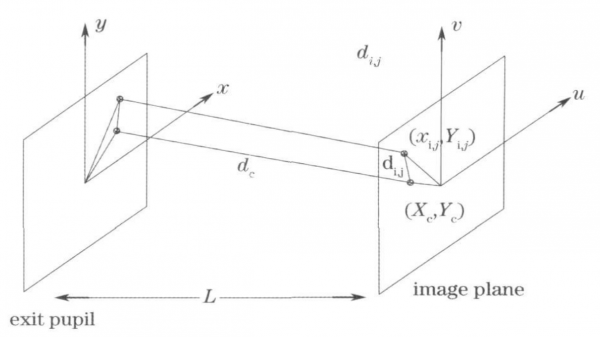
Fig.3 Inverse ray tracing from image plane to exit pupil
The principal ray path from the image plane to the exit pupil plane is

where L represents the distance from the exit pupil surface to the image surface, and Xc and Yc represent the intersection of the main line and the image surface.
The distance from the intersection of other tracing rays on the image plane and the intersection of the image plane to the intersection of the main line is:

where xij and yij represent the intersection coordinates of other non-principal line tracing rays and the image plane. Calculate the cosine of the solid angle of the space traced ray from the image plane
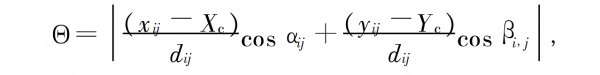
where αij , βij represent the direction angle of the reflected ray at the intersection point (i, j) of the tracing ray and the image plane. The optical path difference of other tracing rays from the image plane to the exit pupil plane relative to the main line

The actual situation considers the optical path difference from the light source position to the exit pupil, and finally the optical path difference from the light source to the exit pupil can be obtained as

After two optical traces, the optical path difference dsource→exit pupil at the exit pupil position is obtained, and the complex amplitude is composed of amplitude and phase. The amplitude is the spatial distribution of light intensity u(x,y), and the complex amplitude is expressed as u(x,y) )·exp(i·dsource→exit pupil). The exit pupil surface wavefront includes all the errors introduced by the system, and the ideal diffraction focusing can be considered from the exit pupil surface to the focal surface. The focal plane complex amplitude and its light intensity distribution.
3 Discuss angular and positional misalignment
Taking the beam arrangement of a prototype device in China as the beam combining model, the single beam diameter is 290mm×290mm, and the aperture intervals along the x and y directions are 230 and 70mm respectively.
The light intensity of each beam section is not uniformly distributed in the clear aperture, but is edge softened. A Gaussian square beam is used to describe the cross-section spatial distribution of the propagating beam u(x,y) = exp, R0=11cm is the beam waist n=10 is the order, Figure 4 shows the normalized distribution of the sub-aperture beam amplitude.
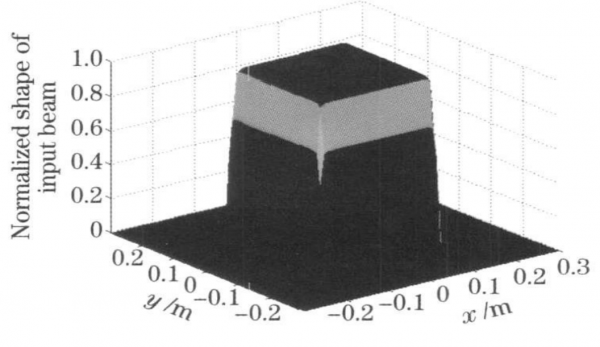
Fig. 4 Normalized amplitude function of masking aperture
The following will discuss the influence of the 6-dimensional adjustment amount of the spliced sub-mirror on the focal spot shape, the local coordinate system of the sub-mirror and the adjustment amount: the in-plane rotation angle around the z-axis and the out-of-plane inclination angle (rotation angle around the x/y axis), the in-plane rotation angle around the z-axis The misalignment of eccentricity and out-of-plane displacement in the x and y directions is shown in Figure 5.
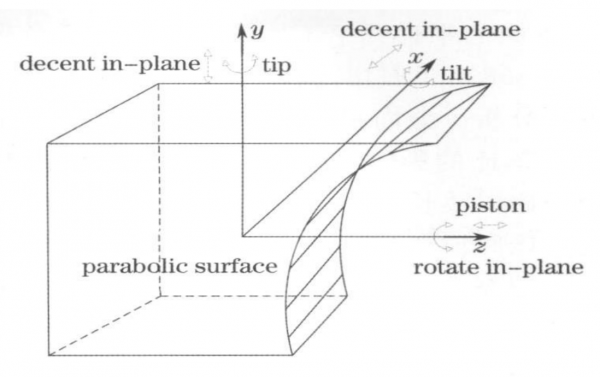
Fig.5 Local coordinate of segmented mirror
3.1 Angle misalignment
The in-plane rotation around the z-axis and the out-of-plane tilt around the x and y axes of the local coordinate system in Figure 5 will deviate from the parabolic equation and affect the focal spot shape and focus position. In this paper, the focal spot Strehl ratio (the focal spot peak intensity The ratio of the focal spot peak intensity under ideal conditions) and the 20μm diameter surrounding power ratio (the ratio of the power within the 20μm diameter of the center of the focal plane to the total power of the focal plane) describe the focal spot quality and central energy concentration. Figure 6 shows the effects of the misalignment of a certain sub-mirror angle in the spliced parabolic mirror on the Strehl ratio and the surround power ratio.
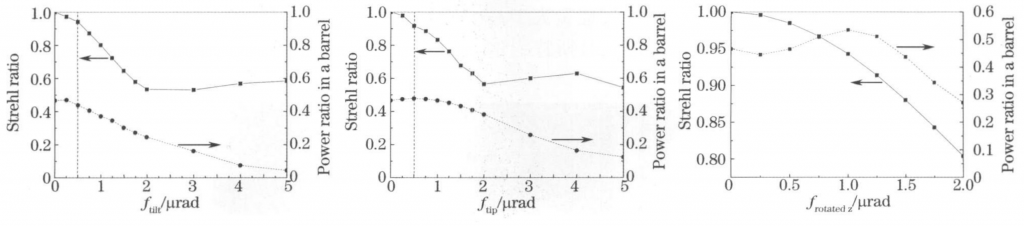
Fig. 6 Normalized amplitude function of masking aperture
The calculation shows that the Strehl ratio and the surrounding power ratio of the left and right tilted focal spots have the greatest influence, and the influence of the in-plane rotation angle is the smallest. It is not necessary to actively control the in-plane rotation angle. Considering the environmental vibration factors, the control accuracy of the drive is determined to be 1 μrad (±0.5 μrad). Figure 7 (a) and (b) show the change of the interference pattern of the focal plane when the angle is tilted and misaligned. It can be seen that the center position of the light spot moves toward the deviation of the misalignment angle, resulting in more and more energy in the central circle of the focal plane. The effect of in-plane rotation focus spot movement for small the same misalignment angle is much smaller than that of angular tilt, as shown in Fig. 7(c).
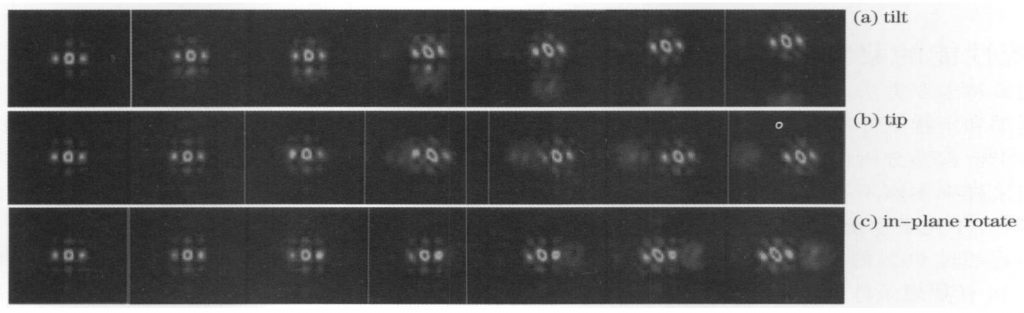
Fig. 7 Interference pattern of focal plane
3.2 Position misalignment
According to the paraboloid formula 2fy=x²+z², when the sub-mirror translates along the x and z directions, the focal position of the paraboloid will also move with the in-plane translation, Figure 8(a) gives a geometric illustration of the reflected rays, Figure 8(b) and (c) reflect the focal plane interference pattern after the sub-mirror is translated in the x and z directions by 200 μm; the translation in the x direction hardly affects the shape and position of the focal spot, and the translation in the z direction is 200 μm. The Terrell ratio and the surround power ratio drop to 0.808 and 0.443, respectively, so the effect of in-plane translation can be ignored during active control.
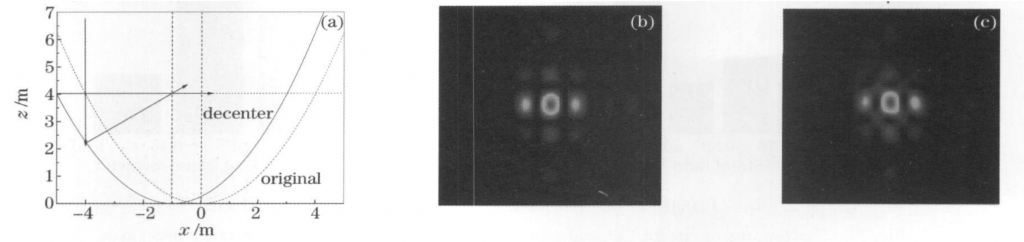
Fig. 8 In-plane decent effect on focal character of segmented parabolic mirrors
The effects of the z-direction translation position offset amount on the focal point Strehl ratio and the surround power ratio are separately analyzed, as shown in Figure 9.
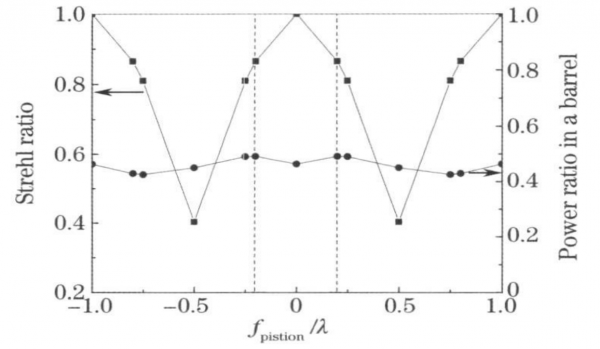
Fig. 9 Strehl ratio and power ratio in a barrel versus piston
In the figure, the Strehl ratio and the surrounding power ratio change sinusoidally with the wavelength as the period, and within the range of 0.2λ, the Strehl ratio and the surrounding power ratio have the same trend of change. Therefore, the control accuracy of the translation amount is determined as ±105.3 nm (λ=1.053 μm, ±0.1 2). To make the results more intuitive, Figure 10 shows the focal plane interference patterns at 0.2 λ, 0.25 λ. 5 λ, 0.75 λ, and 0.8 λ, respectively. The position misalignment does not change the position of the center of gravity of the focal spot, so it is greater than 3 times the ring within the diffraction limit. The fluctuation of the surrounding power is small, which mainly affects the shape of the focal spot. When fpiston≤0.5λ focal spot left side lobe energy is greater than right side lobe. When fpiston>0.5λ, the right side lobe transfer energy of the focal spot is greater than that of the left side lobe. There is obvious focal spot splitting at 0.5λ, where the Strehl ratio is the lowest.
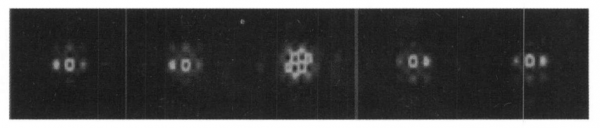
Fig. 10 Interference pattern of focal plane(piston decent∶0.2 λ,0.25 λ,0.5 λ,0.75 λ,0.8 λ)
4 Monte Carlo tolerance analysis of system performance
Error tolerance analysis of 12 (4 sub-mirrors 3 parameters) independent parameters using Monte Carlo method: each Monte Carlo cycle randomly generates a specific error value within the set parameter accuracy range and disturbance statistical model All The error parameters obey the normal statistical distribution, and the number of statistics is 100 times.
Monte Carlo error analysis estimates the true system performance under the error specification. Statistical results are very useful for engineering tasks, but because the sampling rate is not sufficient to strictly follow the statistical results, Monte Carlo error analysis reveals the error The probability of predicted system performance within the range is still a very important analytical method for optical systems.
From Figure 11, it can be seen that within the error range of tilt/tip-piston, the statistical number of the Strehl ratio exceeding 60% falls within the range greater than 0.8 (1 under ideal conditions). The number of statistics falls within the range of more than 0.4 (0.464 under ideal conditions), and the success rate of focused shooting at this time (the Strehl ratio is greater than 0.8, and the ratio of the surrounding power is greater than 0.4) reaches 60%. , NIF requires the angular drift root mean square error of the ultra-short pulse drive system to be controlled within the range of ±1μrad, which relaxes the control requirements compared with this paper, but it needs to be clear that the design goal is for the 40μm diameter ring power ratio.
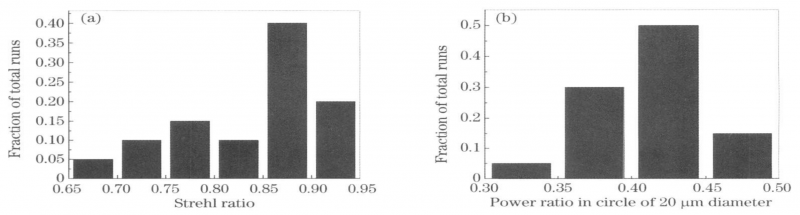
Fig. 11 Histograms of Strehl (a) and power ratio (b) by Monte-Carlo tolerance analysis
5 Conclusion
Combined with the calculation characteristics of geometric optical tracing and Fourier transform, a 2 × 2 90° spliced off-axis parabolic mirror model was established for simulation calculation, and the 3-dimensional in-plane and out-of-plane angle and 3-dimensional position misalignment parameters were analyzed. Influence of the focusing properties of an axial parabolic mirror.
Calculations show that the influence of the focal spot shape of the angular tilt is similar, the angle deviation of 2 μrad causes the Strehl ratio to be less than 0.6, but the effect of the center shift of the left and right tilt focal spot is more serious, when ftilt=5 μrad the center of the focal plane is 20 μm The ring-to-circle power ratio in the diameter circle is close to zero, and the in-plane angle rotation is insensitive to the influence of the focal spot shape and position. Active control of position misalignment is not required. The out-of-plane position misalignment affects the focal spot shape, Strehl ratio and ring. The splicing needs to actively control the angle tilt and position misalignment, and the accuracy is ±0.5 μral and ±105.3 nm, respectively, and the corresponding splicing introduced the tilt phase peak-valley error of 0.28 λ translation phase error is λ/5.
Under this accuracy condition, the Monte Carlo error analysis method is used to predict the focusing performance of the splicing system. The probability of Strehl ratio greater than 0.8 and surround power ratio greater than 0.4 exceeds 60%, which has good focusing characteristics and is suitable for large-scale The design and assembly of the target focusing terminal of the high-energy short-pulse solid-state laser device has guiding significance.