Contrastive measurement of off-axis paraboloids
off-axis paraboloid; stigmatic null test; Luphoscan; dynamic interferometer
Abstract
An off-axis paraboloid with an off-axis angle of 45° and a diameter of 1 inch was used as the sample to compare the difference between the traditional null interferometric measurement results and the non-contact 3D aspheric optical surface shape measurement system Luphoscan.
Zemax was used to simulate the influence of the adjustment errors of the six dimensions of the off axis paraboloid on the measurement results. The expression of off-axis error in the two completely different measurement processes was analyzed, which solved the problem of the availability of Luphoscan measurement results. According to the simulation results, the null test interference optical path structure based on the dynamic interferometer was set up, and the six-dimensional adjustment standard process of the off-axis paraboloid was established, which could quickly eliminate the adjustment error and off-axis quantity error, and the repeatability test results reach the accuracy of pv=0.135λ.
Introduction
High-precision aspheric optical components play an important role in space optics, space laser communication, aerospace and other fields.
Among them, the off-axis aspherical mirror is an indispensable part of the development of advanced optical systems towards miniaturization and high performance. Its application can effectively avoid the central occlusion of the optical system and improve the corresponding diffraction problems to improve the imaging quality, especially its large distance. Axial mirrors increase the working focal length and the angle of light path refraction.
With the increasing development of CNC machining technology in optical advanced manufacturing, precision measurement of aspheric surfaces is required for guidance and inspection in multiple stages of manufacturing, which puts forward higher requirements for aspheric surface inspection. The zero-position detection method in interferometry is the main measurement method in the aspheric surface polishing stage. It has the advantages of high resolution, high accuracy, high sensitivity and good repeatability. It has been widely recognized after long-term use and verification.
The Luphoscan developed by Taylor Hobson is a non-contact three-dimensional topography point scanning measurement system based on multi-wavelength interference technology. Luphoscan realizes the continuous positioning of the measurement sensor through the compensation system, and compensates the mechanical errors of the R, Z and T axes. With the ultra-high precision multi-wavelength interferometric sensor technology, it solves the problem of single-wavelength measurement of the phase in the continuous steep area. The blurring problem guarantees an accuracy better than 50 nm over the entire area.
In practical applications, the measurement results of Luphoscan and the interferometric measurement results have excellent agreement in the measurement of simple function surfaces such as planes and spheres, but there is a big difference in the measurement of aspheric surfaces, such as in the measurement of rotationally symmetric paraboloids and When the paraboloid is off-axis, the measurement results will show different degrees of astigmatism. In this paper, the off-axis paraboloid is measured by the aberration-free point method and the Luphoscan measurement system, and the manifestations of the off-axis error in the two measurement processes are analyzed, the usability of the Luphoscan measurement results is solved, and the aberration-free point is established The adjustment standard process of measuring off-axis paraboloids by method can quickly eliminate adjustment errors and off-axis measurement errors.
1 Theoretical analysis of wave aberration introduced by offset error
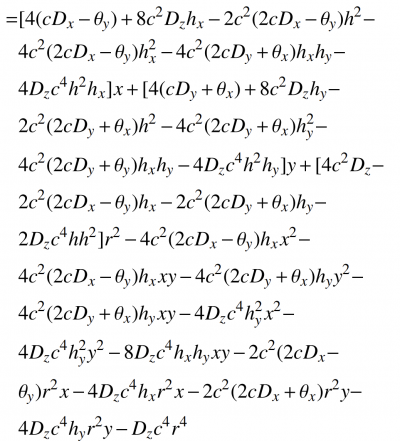
For the detection of off-axis paraboloids by the aberration-free point method, if the paraboloid is in the ideal position, the detection result only includes the component surface error, and when any dimension of the paraboloid deviates from the ideal position, the measurement result will introduce an offset error. The schematic diagram of the offset is shown in the figure. 1 shown.
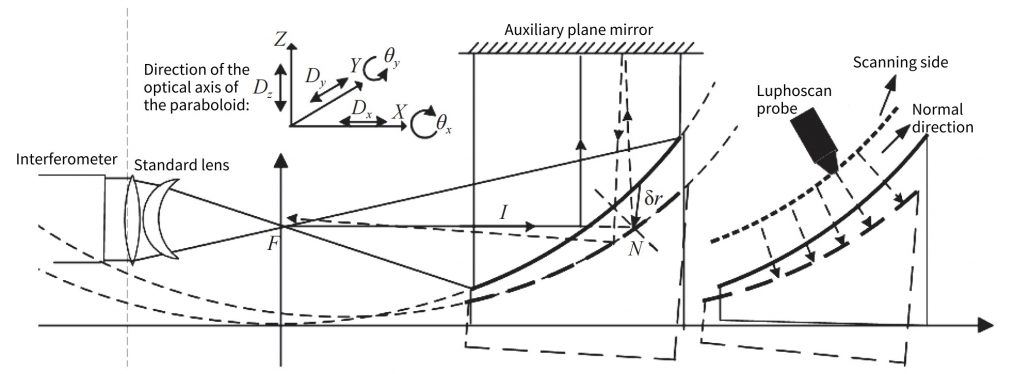
Fig. 1 Diagram of off-axis paraboloid misalignment
In Figure 1, a part of the parallel light emitted by the interferometer is condensed at the confocal position F by the standard lens, continues to propagate to the paraboloid for reflection, and finally is reflected by the plane mirror and returns to the original path to form the test light, while the other part is reflected by the reference reflection surface of the standard lens. Return to form the reference light, which interferes with the test light. In the aberration-free point method, the test light is incident in the non-normal direction, while the Luphoscan probe in the right half of Figure 1 is always perpendicular to the DUT and performs a spiral motion, that is, the test light is incident in the normal direction.
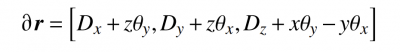
There is a turning point in the optical path of the aberration-free method, and there are the optical axis direction of the interferometer and the optical axis direction of the paraboloid. As shown in Figure 1, the coordinate axis is defined according to the optical axis direction of the paraboloid. There are five dimensions of adjustment for the rotationally symmetric paraboloid, which are the displacements Dx, Dy, and Dz along the X, Y, and Z axes, and the rotations θx and θy around the X and Y axes, respectively. According to the theory of a single optical surface eccentric system In the presence of Dx, Dy, Dz, and θx, θy adjustment errors, the wave aberration formula of the parabolic parent mirror detection system is:
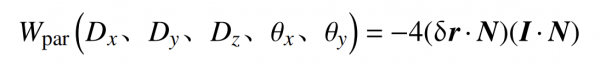
Formula 1
Among them: δr is the displacement vector of any point; N is the unit normal vector of any point; I is the unit vector of the incident light; the mathematical expression of the detected off-axis aspheric mother mirror is:
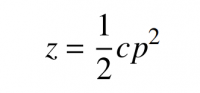
Formula 2
Where:
p2 = x2 +y2 represents the distance between any point in the aperture of the parent mirror and the geometric center;
c is the vertex curvature, then the unit normal vector of any point on the surface can be expressed as
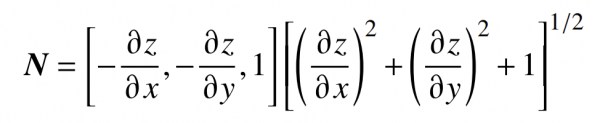
Formula 3
According to the coordinate relationship of the displacement vector, we have
Formula 4
Substitute equations (2), (3) and (4) into equation (1), and transform the pupil of the detection system from the mother mirror to the sub-mirror. The distances in the X and Y directions of the center point P of the parent mirror are hx and hy respectively. Using the exit pupil transformation matrix, the wave aberration of the off-axis paraboloid detection system is obtained as
Formula 5
Among them:
r2 = x2 +y2, that is, the distance from one point on the sub-mirror to the center O point.
It can be seen from equation (5) that for the off-axis paraboloid Dx, Dy, Dz, θx, θy act together on the coma and astigmatism terms, and the astigmatic term is the main error term.
Fig. 2 Exit pupil transformation diagram
2 Simulation and experiment of aberration-free point method
2.1 Zemax simulation of aberration-free point method
The aberration-free point method measurement of off-axis paraboloids has been simulated by Zemax in advance. The interferometric cavity layout with the incident converging light is adopted, and the optical path diagram of the simulation test is shown in Figure 3.
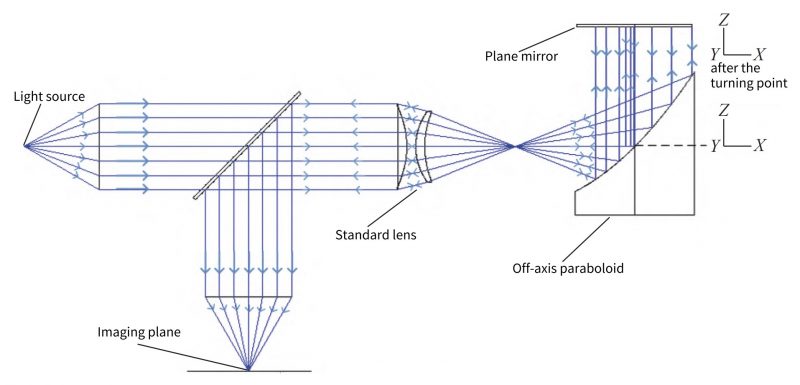
Fig. 3 Optical path simulation
The interferometer model is a simplified model, and the last surface of the standard lens is the reference reflection surface, and part of the light beam is reflected from this surface and returns to form the reference light.
When no adjustment error is added, the interferogram is zero fringe pattern, and a small amount of adjustment error is added in each dimension. The representation of each dimension is based on the transformed coordinate system in Figure 3. Observe the changes of the interferogram and Zernike coma and astigmatism Figure 4 shows the influence of the adjustment error of each dimension on the aberration, where: the linear relationship curve corresponds to the middle vertical axis; the nonlinear relationship curve corresponds to the right secondary vertical axis.
Fig. 4 Influence of adjustment error on aberration
2.2 Aberration-free point method experiment
As shown in Figure 5, the aberration-free point method is used to measure the off-axis paraboloid.
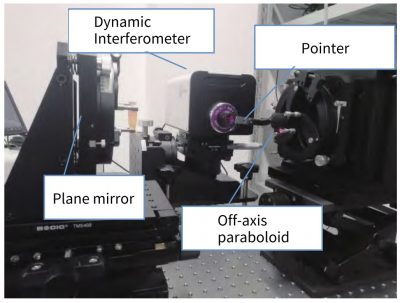
Fig. 5 Actual measurements of stigmatic null test
The components used are a paraboloid with a diameter of 1 inch, an off-axis angle of 90°, a focal length of 127 mm (off-axis), a standard lens of f/3, Standard flat crystal, experimental devices include new dynamic interferometer, two-dimensional adjustment frame, and five-dimensional adjustment frame. Figure 6 shows the light spot change diagram during the rough adjustment process, (a), (b), (c), (d) correspond to the corresponding light spot diagrams after each step of rough adjustment, respectively.
The experimental steps are divided into two steps: coarse alignment and fine adjustment. The new dynamic interferometer used in the experiment has a point-to-point function, which facilitates the adjustment of the rough alignment process. Steps for rough alignment:
- Use the point finder to observe the return focus focusing spot formed by the off-axis paraboloid and the plane reflector, which needs to coincide with the focusing point of the interferometer. The reflected spot will have obvious random off-axis astigmatism at this time, that is, the oblique stripe For the light spot (Fig. 6(a)), when adjusting the defocus, there is a phenomenon that the long light spots appear alternately in two directions;
- When a large off-axis amount is eliminated by pan/tilt adjustment, it takes more time
Therefore, in the second step, the in-plane rotation of the off-axis paraboloid can be performed, and the two-dimensional tilt adjustment of the mirror can be used to make the astigmatic spot shorter and the direction to be horizontal and vertical (Fig. 6(b)); - By adjusting the translation of the dynamic interferometer (or off-axis paraboloid) in a single direction (X or Y), and with the tilt of the plane mirror, the shape of the spot is further changed to a circle (Fig. 6(c)).
After the rough alignment is completed, the interferogram has basically become a circle, and the interferogram has obvious astigmatism (Fig. 6(d)). The interferogram at this time can be used for preliminary testing. Next, perform fine adjustment through the wavefront test results, set the measurement mode to continuous measurement, and dynamically detect the adjustment results in real time.
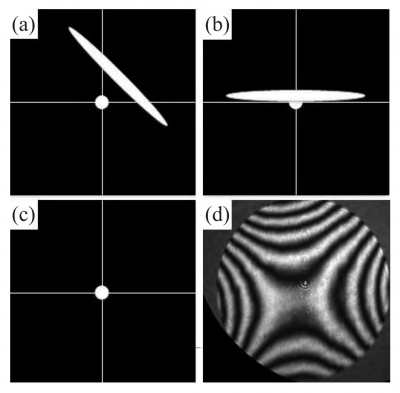
Fig. 6 Variation diagram of rough adjustment process
Fine tuning steps:
- Adjust the Z-direction translation and pitch of the paraboloid, which is called an adjustment pair, or adjust the Y-direction translation and tilt of the paraboloid. For example, you can try to adjust the Z direction to make the interference fringes denser and the center shift, and then adjust the pitch to compensate, so that the center of the interference fringes continues to return to the center. Observe the pv value of the test result or the astigmatism item to determine whether the adjustment direction is correct. If the astigmatism item becomes larger, adjust in the opposite direction. Repeat this step until the astigmatic term value converges. At this time, you need to change the Y-direction translation and tilt of the paraboloid to adjust, and repeat the above steps as well. After repeated tuning of the two tuning pairs to converge, the astigmatic term essentially converges to 0.03 λ.
- Fine-tune the spin dimension of the paraboloid. Since a five-dimensional adjustment frame without rotation is used, the spin cannot be adjusted by the paraboloid, but the Y-direction translation and pitch of the dynamic interferometer can be adjusted to achieve this purpose, making the astigmatism and the pv value is further reduced.
- At this time, the interferogram is obviously defocused. Adjust the defocus in the Z direction of the dynamic interferometer to straighten the interference fringes. Adjust the Z-direction translation or Y-direction translation of the paraboloid appropriately so that the number of interference fringes is reduced to zero fringes.
Collect the data and process the constant cancellation, tilt and defocus terms. Figure 7(a) is the interferogram, and Figure 7(b) is the wavefront diagram. Table 1 shows the first few items of the Zernike coefficient of the measurement result, and the measurement result pv=0.137 λ , the astigmatism term Astig=0.024 λ, and the root mean square value of pv of multiple repeatability measurement results is pv=0.135 λ.
Tab. 1 Zernike coefficient of measured results
| wdt_ID | Aberration | Mag. waves |
|---|---|---|
| 1 | Tilt | 0.017 |
| 2 | Focus | 0.013 |
| 3 | Astig | 0.024 |
| 4 | ComaSpherical | 0.035-0.01 |
The measurement results include the error of the standard lens and the error of the plane mirror. The pv value of the standard flat crystal is better than 1/40λ, and the pv value of the standard lens is better than 1/20λ. The interference fringe pattern is nearly zero fringes, and the off-axis measurement error and adjustment The errors have been eliminated, and the surface topography of the paraboloid can be directly distinguished. Comparing the wave surface after unpacking, the car marks left by the paraboloid machining can be clearly seen.
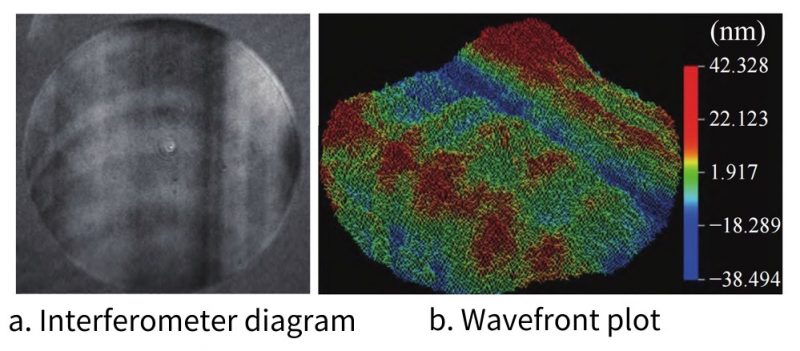
Fig. 7 Software acquisition results of dynamic interferometer
3 Luphoscan measures off-axis paraboloids
As a kind of profile measuring instrument, Luphoscan measures the surface shape error by measuring the coordinates of the real point in the theoretical coordinate system, and then comparing with the theoretical coordinates to obtain the surface shape error. When Luphoscan measures off-axis paraboloids, parameters such as the radius of curvature of the parent mirror, off-axis angle, aperture, measurement resolution, etc.
Input into the sag table calculation software of the off-axis paraboloid to obtain the theoretical design point cloud of the off-axis paraboloid.
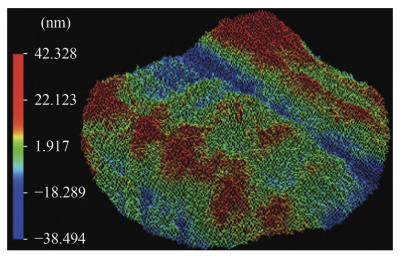
Ideally, the X-axis of the measurement coordinate system is the tangent at the off-axis position, and the Y-axis passes through the coordinate at this off-axis position. The situation of the off-axis paraboloid in the Luphoscan measurement is shown in Fig. 8. The off-axis paraboloid is clamped horizontally by the configured tooling. Due to the symmetry in the Y direction of the off-axis paraboloid, it is easy to adjust the inclination and eccentricity error in the Y direction, and then coarsely adjust the inclination in the X direction. Until the sag is consistent with the theoretical design, but the actual paraboloid has an off-axis amount error, which makes the eccentricity and tilt errors still exist after leveling and centering in the X direction.
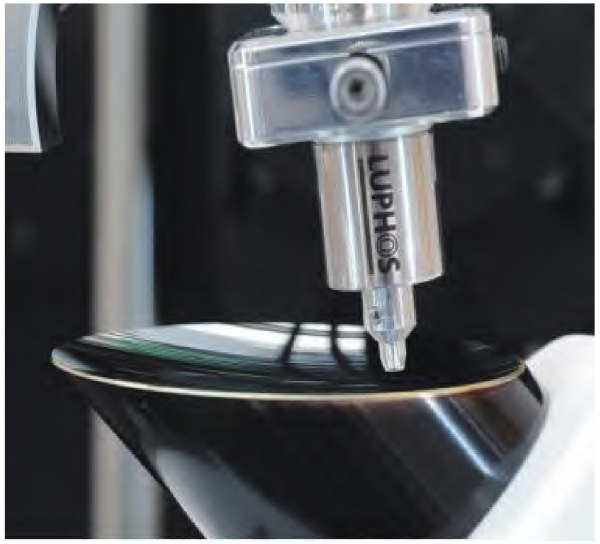
Fig. 8 Luphoscan measurement of off-axis paraboloids
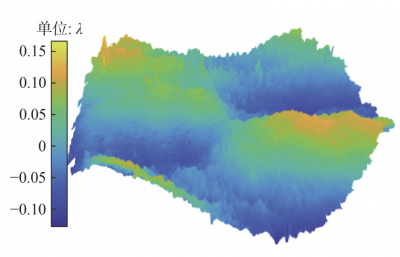
Then the probe makes a spiral motion along the theoretically designed curve, always perpendicular to the measurement surface, and measures the actual deviation value of each point in turn, that is, the discrete off-axis parabolic surface data. The measurement results are shown in Fig. 9. The additional errors included are directly or indirectly introduced by the off-axis error, and the actual surface shape cannot be obtained simply by fitting the Zernike polynomial to the astigmatism.
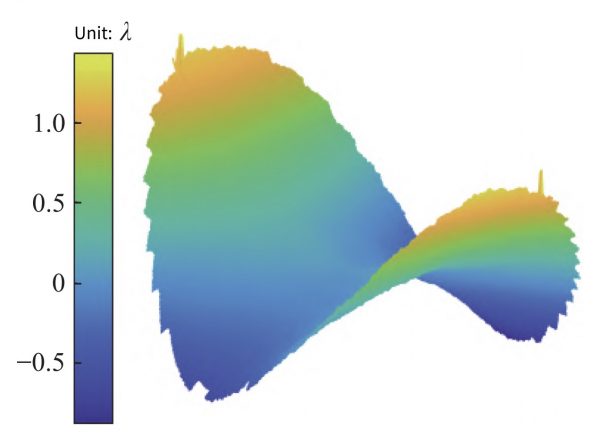
Fig. 9 Measurement results read by MATLAB
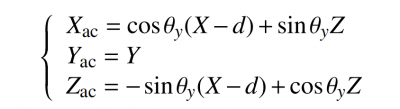
The aberration-free point method measures the surface shape parameters under the actual off-axis quantity. Assuming that the data measured by the interferometer is an ideal absolute surface shape, the measurement result is recorded as, and the off-axis paraboloid vector height distribution of the actual off-axis quantity is recorded as, then It is the sag value on the world coordinate, and the X and Y components of the world coordinate can be calculated according to the CCD pixel size of the interferometer; the inclination angle error in the X axis direction is recorded as d, and the eccentricity error is recorded as d, so there are tilt and eccentricity. The point cloud data of , as shown in below formula
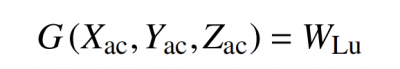
Fit the point cloud data of above formula into a curved surface, use a suitable algorithm to calculate the vertical distance from each point of the theoretically designed point cloud to the curved surface, record the process as mapping G, and record the final Luphoscan measurement data as WLu , then there is the following relationship
Finally, the comparison of the Luphoscan measurement with the interferometer measurement is shown in Table 2.
Tab. 2 Comparison of Luphoscan and dynamic interferometer measurements
| Measurement method | Measurement process | Aberration judgment | Luphoscan measurement results Preliminary astigmatism and results |
| Dynamic Interferometer | Based on the principle of zero-position interference, the paraboloid is adjusted to make the interference pattern close to zero fringes, and the surface shape is obtained by unpacking. | There is no obvious aberration, but the off-axis amount error is regarded as the adjustment error adjusted away. |
 |
| Luphoscan | Based on the principle of multi-wavelength interferometric ranging, the eccentricity and inclination of the off-axis paraboloid are determined by matching the actual and theoretical sag values in a small area of the paraboloid, and then the scanning path is planned according to the theoretical equation of the off-axis paraboloid. The scanning process is always perpendicular to the surface to be measured. Deviation from the theoretical value is taken as the measurement result. | There is an obvious astigmatism term |
 |
4 Conclusion
In this paper, the traditional aberration-free point method and Luphoscan are used to compare and measure the off-axis paraboloid. The measurement result of the aberration-free point method has no obvious aberration, but the Luphoscan measurement result has obvious astigmatism.
When the aberration-free point method detects off-axis paraboloids, when adjusting the attitude of the paraboloid, it is always adjusted in the direction of reducing the coma and astigmatism terms, and the off-axis error can be regarded as the superposition of the eccentricity errors in the X and Z directions, will inevitably introduce astigmatism and coma.
In the process of experimental adjustment, the off-axis error is artificially regarded as an adjustment error to be adjusted and eliminated. Therefore, the traditional aberration-free point method cannot detect the off-axis error, but this measurement method can accurately measure the actual off-axis amount of the paraboloid. . Since Luphoscan performs a spiral motion along the theoretical design curve during measurement, it measures the deviation between the theoretical value and the actual value. Therefore, the final measurement result includes the off-axis error, which solves the usability problem of the Luphoscan measurement result. The aberration term is reversed to obtain the off-axis error, and the absolute measurement of the actual off-axis paraboloid is restored.